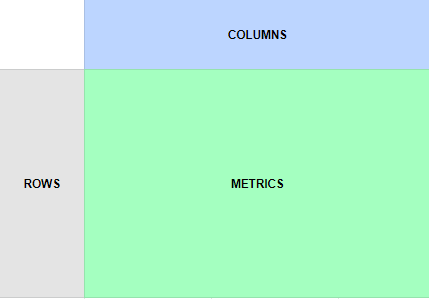
The fields box is simply the collection of dimensions/metrics you want to import from the particular data source. Once you select the account, the relevant fields will be populated.
What Fields are available in DigiXport?
You can check the entire list of all the fields available across all the data sources here.
How To Order the Fields?
You can simply drag & drop the fields by clicking on it.
What to do if some fields are not available?
If some fields are not available, you can simply click on the refresh icon above the fields section.
It might happen that some custom conversions for the Facebook account are not getting populated, you can then click on the refresh icon.
If still you don’t see the expected fields, you can mail us at [email protected].
How To Split the rows by columns?
By default, all the data will be split by rows.
To use split by columns simply click on selected fields. The highlighted color represents:
- Grey: Split By Rows
- Blue: Split By Columns
- Green: Values (metrics)
Let’s look at some examples.
EXAMPLE #1
For Bing Reports, we have selected 3 fields:
- Campaign Name
- Date
- Spend
Now, let’s split the date field into columns.
Simply assign
- Date – > Blue color
- Spend – > Green color
and the output is as follows:
EXAMPLE #2
In Facebook, let’s try to split the amount spent per campaign age-wise.
So we’ll select 3 fields
- Campaign Name
- Age
- Amount Spent
Now, simply assign
- Age -> Blue Color
- Amount Spent -> Green Color
And here’s the output.
EXAMPLE #3
Now, let’s look at data containing multiple values
So we’ll select 4 fields in Facebook Post
- Post Message
- Post Published Date
- Likes (Count)
- Comments (Count)
Now, simply assign
- Post Published Date -> Blue Color
- Like (count) -> Green Color
- Comment (count) -> Green Color
And here’s the output.
Important:
- Make sure to select both Split by Column (blue) & Values (green) fields. (the grey field represents split by row fields)
- Assigning just green values to all fields will default to split by rows.


