Last Updated on February 22, 2018 by Ritwik B
Well, then you have come to the right place!!!
This Adwords script will output your adwords data to google spreadsheet and create tables/charts for you to analyze the performance.
Also, it will also let you filter the data by date and keyword. If you want to know more about Quality score, go to Check and Understand Quality Score.
Copy this..
Quality Score Optimizer Script
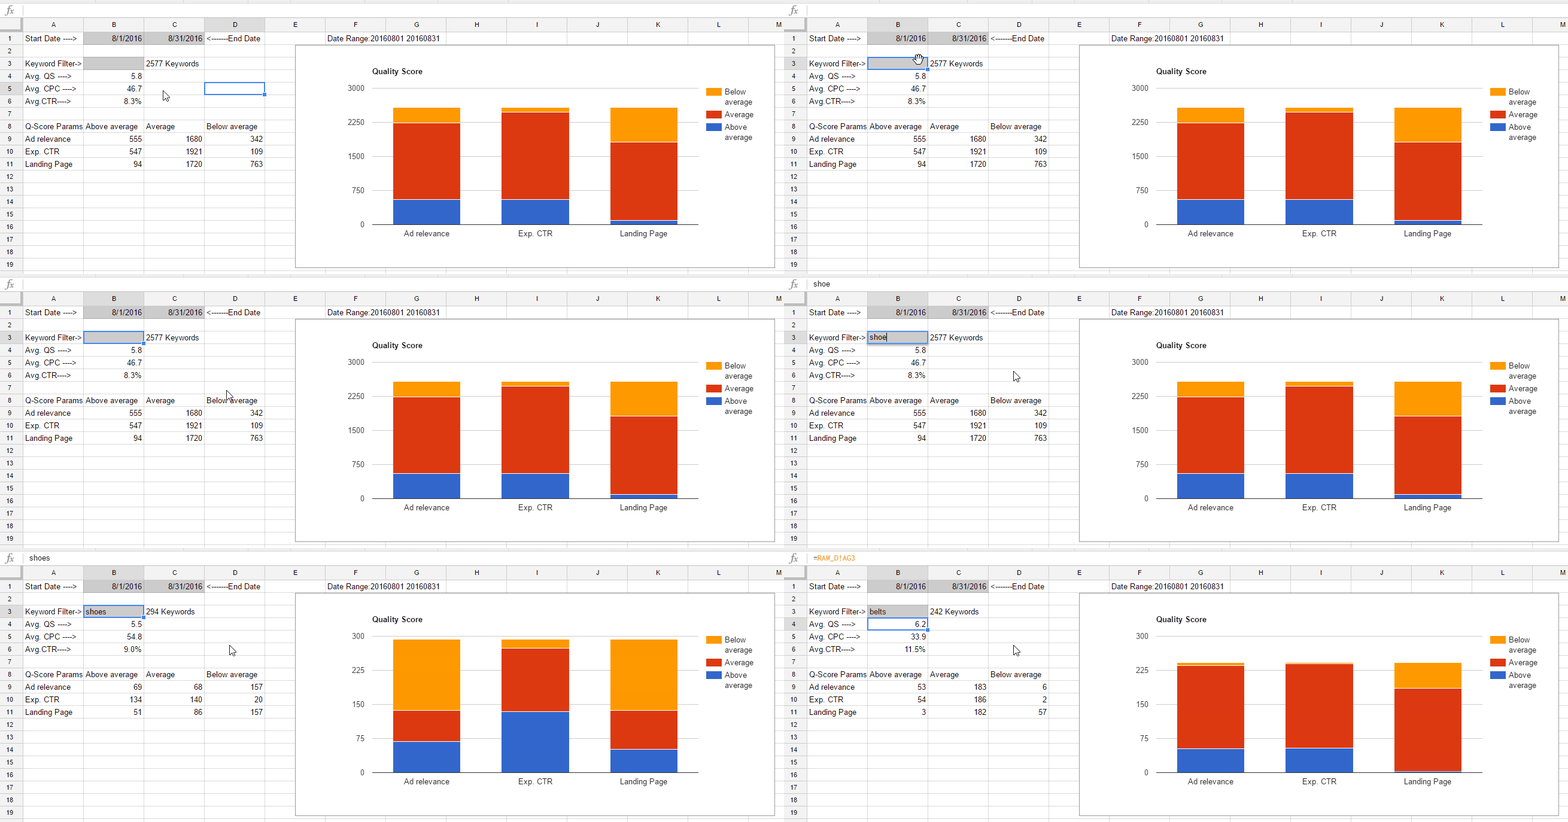
This is what you’ll get after running the script:

Note: Only keywords having Active Campaigns, Adgroups would be included
- You can now see the Quality Score factors for your group of keywords and also their Avg. CPC, CPA and CTR based on selected date range.
- Also you can filter the data by keywords. Eg: If you want to see the data for only the keywords containing ‘shoes’ just enter the shoes in the grey box.
- We can start analyzing, by how google has rated my Landing page, Ads, Exp CTR? Are my ads relevant to particular keywords? Are the landing pages relevant or should I modify/create new to improve my performance?, etc.
Quality Score Opitmizer – Adwords Scripts
For those who already know how to use Adwords Scripts, just run the the code which you will get in Step – 1 and go to step – 8. Others, start from below:
Step 1:
- Copy the code from –> Quality Score Optimizer Script
Step 2:
- Go to your Adwords account > Bulk Operations > Scripts
Step 3:
- Click on SCRIPTS and paste the code.
Step 4:
- Name the script . Eg: Quality Score Optimizer.
Step 5:
- Paste the whole code ,replacing the “function main() { }” default code. Click Save.
Step 6:
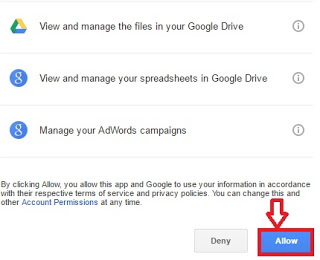
- Now click on Authorize button , and then click allow. The following screenshot might help;
Step 7:
- Now, we are ready to run the script. As this script will NOT change any configuration of your adwords account (bids,keywords,etc), you can also click ‘PREVIEW’ to run the script or simply ‘Run Script Now’.
Step 8:
- When the script runs for first time the report is created for last 7 days by default, but you can change that later. So just copy the URL shown in logs and open it in new tab.
- Tadaaa!!. You’ll open a spreadsheet, which will look similar to this:
- Change the chart “Quality Score vs CPA” by clicking Advanced edit in upper right corner of chart and then > Aggregate Column A.
- The following image might help:
Note:Only the data for active campaigns, adgroups, keywords having impressions > 0 will be included.
Understanding the Quality Score Spreadsheet
Date Range:
- On the very top, you’ll see start date and end date.
- You can set date range for the data to analyse in the format mm/dd/yyyy and again re-run the script.
- For eg: Start date –> 7/1/2016 and end date —> 7/14/2016 for date range 1st July – 14th July, 2016, etc
Keyword Filter:
- Below there is the keyword filter which will filter the data of only those keywords which CONTAINS the entered keyword.
- For eg: Lets say I run ecommerce site for consumer products. If I type ‘shoes’ in the keyword filter, it will filter all keywords which CONTAINS shoes, so that you can analyze just the shoes segment.
- The total filtered keyword data is shown in Block C3. For eg: If I enter ‘shoes’ it will show 1232 keywords. i.e 1232 keywords contain ‘shoes’ word.
- If the filtered keyword is left blank. It will show the data for the whole account for the specified date range.
Average Quality Score:
- Avg. QS: Its the average quality score for the filtered keyword.
Average Cost Per Click:
- Avg. CPC: Its average CPC(Cost per Click) for the filtered keyword.
Average Click Through Rate:
- Avg. CTR: Its average CTR(Click through rate) for the filtered keyword
Quality Score Factors:
- Next table shows Quality Score components/factors.
- Now, if you observe the column/row names it might seem familiar.
- Remember this:
- Yes, the table describes the data about the Quality score factors for the filtered keyword.
- For Eg: If I apply ‘shoes’ filter and I have 1945 keywords which contains shoes, then i will see the table below, which can be interpreted as:
- Ad relevance: I have 202 keywords ‘Above average’ , 1162 ‘Average’ and 581 keywords ‘Below average’ rated by google. So I might check ads for those keywords having ‘Below average’ ad relevance.
- Exp.CTR: Its a predicted CTR by google and not your actual CTR. You can see 315 keywords are ‘Above average, 1377 keywords are ‘Average’ and 253 keywords are ‘Below average’.
- Landing page Exp: It is the estimate by google of how relevant is your landing page to the keyword. We can see 1043 keywords containing ‘shoes’ keywords are ‘Average’ while 902 keywords are ‘Below Average’. If more keywords have landing page ‘Below Average’, then it might be a bit of concern. There are some useful tips by google for improving Landing page experience. Do check it out.
Stacked column chart
- Stacked column chart would be easy to interpret. ( X-axis: Quality score components, Y-axis: No. of Keywords)
- For Eg: In below graph for a particular keyword there is more ‘below average’ part for my landing page, so I should consider working on it.
Quality Score vs CPA vs CPC
- It gives the distribution of CPA and CPC across Quality score for a particular filtered keyword.
- You can use the same keyword filter to filter the data in this table too.
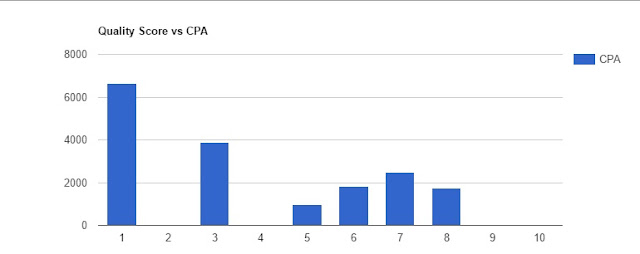
- The below column chart (X-axis:Quality Score ,Y-Axis: CPA) will show you the distribution of CPA across Quality Score.
- So you can see some keywords having 1 and 2 quality score are giving me high CPA. So, I might work on the their quality score factors in the above chart and try to improve them or simply pause it.
- You can also create charts for Quality score vs CPC.
- You can also include other metrics like clicks, cost, conversions,etc through the hidden sheet which contains the raw data.
Additional Points on Quality Score
- While Quality Score is used to give a general sense of quality of ads, but it is NOT considered during auction time.
- During auction time Ad Rank is used which is determined by real time calculation of CTR, Ad relevance and Landing page Experience.
- Well there are Google Best Practices for how to use Quality score to optimize performance. You should download the checklist at the bottom of their page.


