Last Updated on October 8, 2020 by Ritwik B
If you’re NEW to google analytics or have been using it for a long time, it’s essential to know how the USER DATA is sent to the google analytics servers & is reflected on your dashboard.
The basic foundations of the data collection in google analytics is done via “hits“. In this article, we’ll focus on the concept of “Google Analytics Hits“. What is it? What data does it collect? What are its limitations & more…
So let’s get started…
Index
Google Analytics Hits
What is a Hit in Google Analytics?
Let’s first understand what is a “hit”…
According to Google,
“A Hit is an interaction that results in data being sent to Analytics.”
“Each time the tracking code is triggered by a user’s behavior (for example, user loads a page on a website or a screen in a mobile app), Analytics records that activity. Each interaction is packaged into a hit and sent to Google’s servers.“
In simple words, after a specific user interaction, the data is packed & sent to google analytics as a hit. The “hit” contains the user interaction data. We can also send custom data but that’ll be a later post.
So, What exactly is user interaction?? Well, the basic one is the PAGE LOAD.
Here’s the process that takes place when the user lands on your website & page loads.
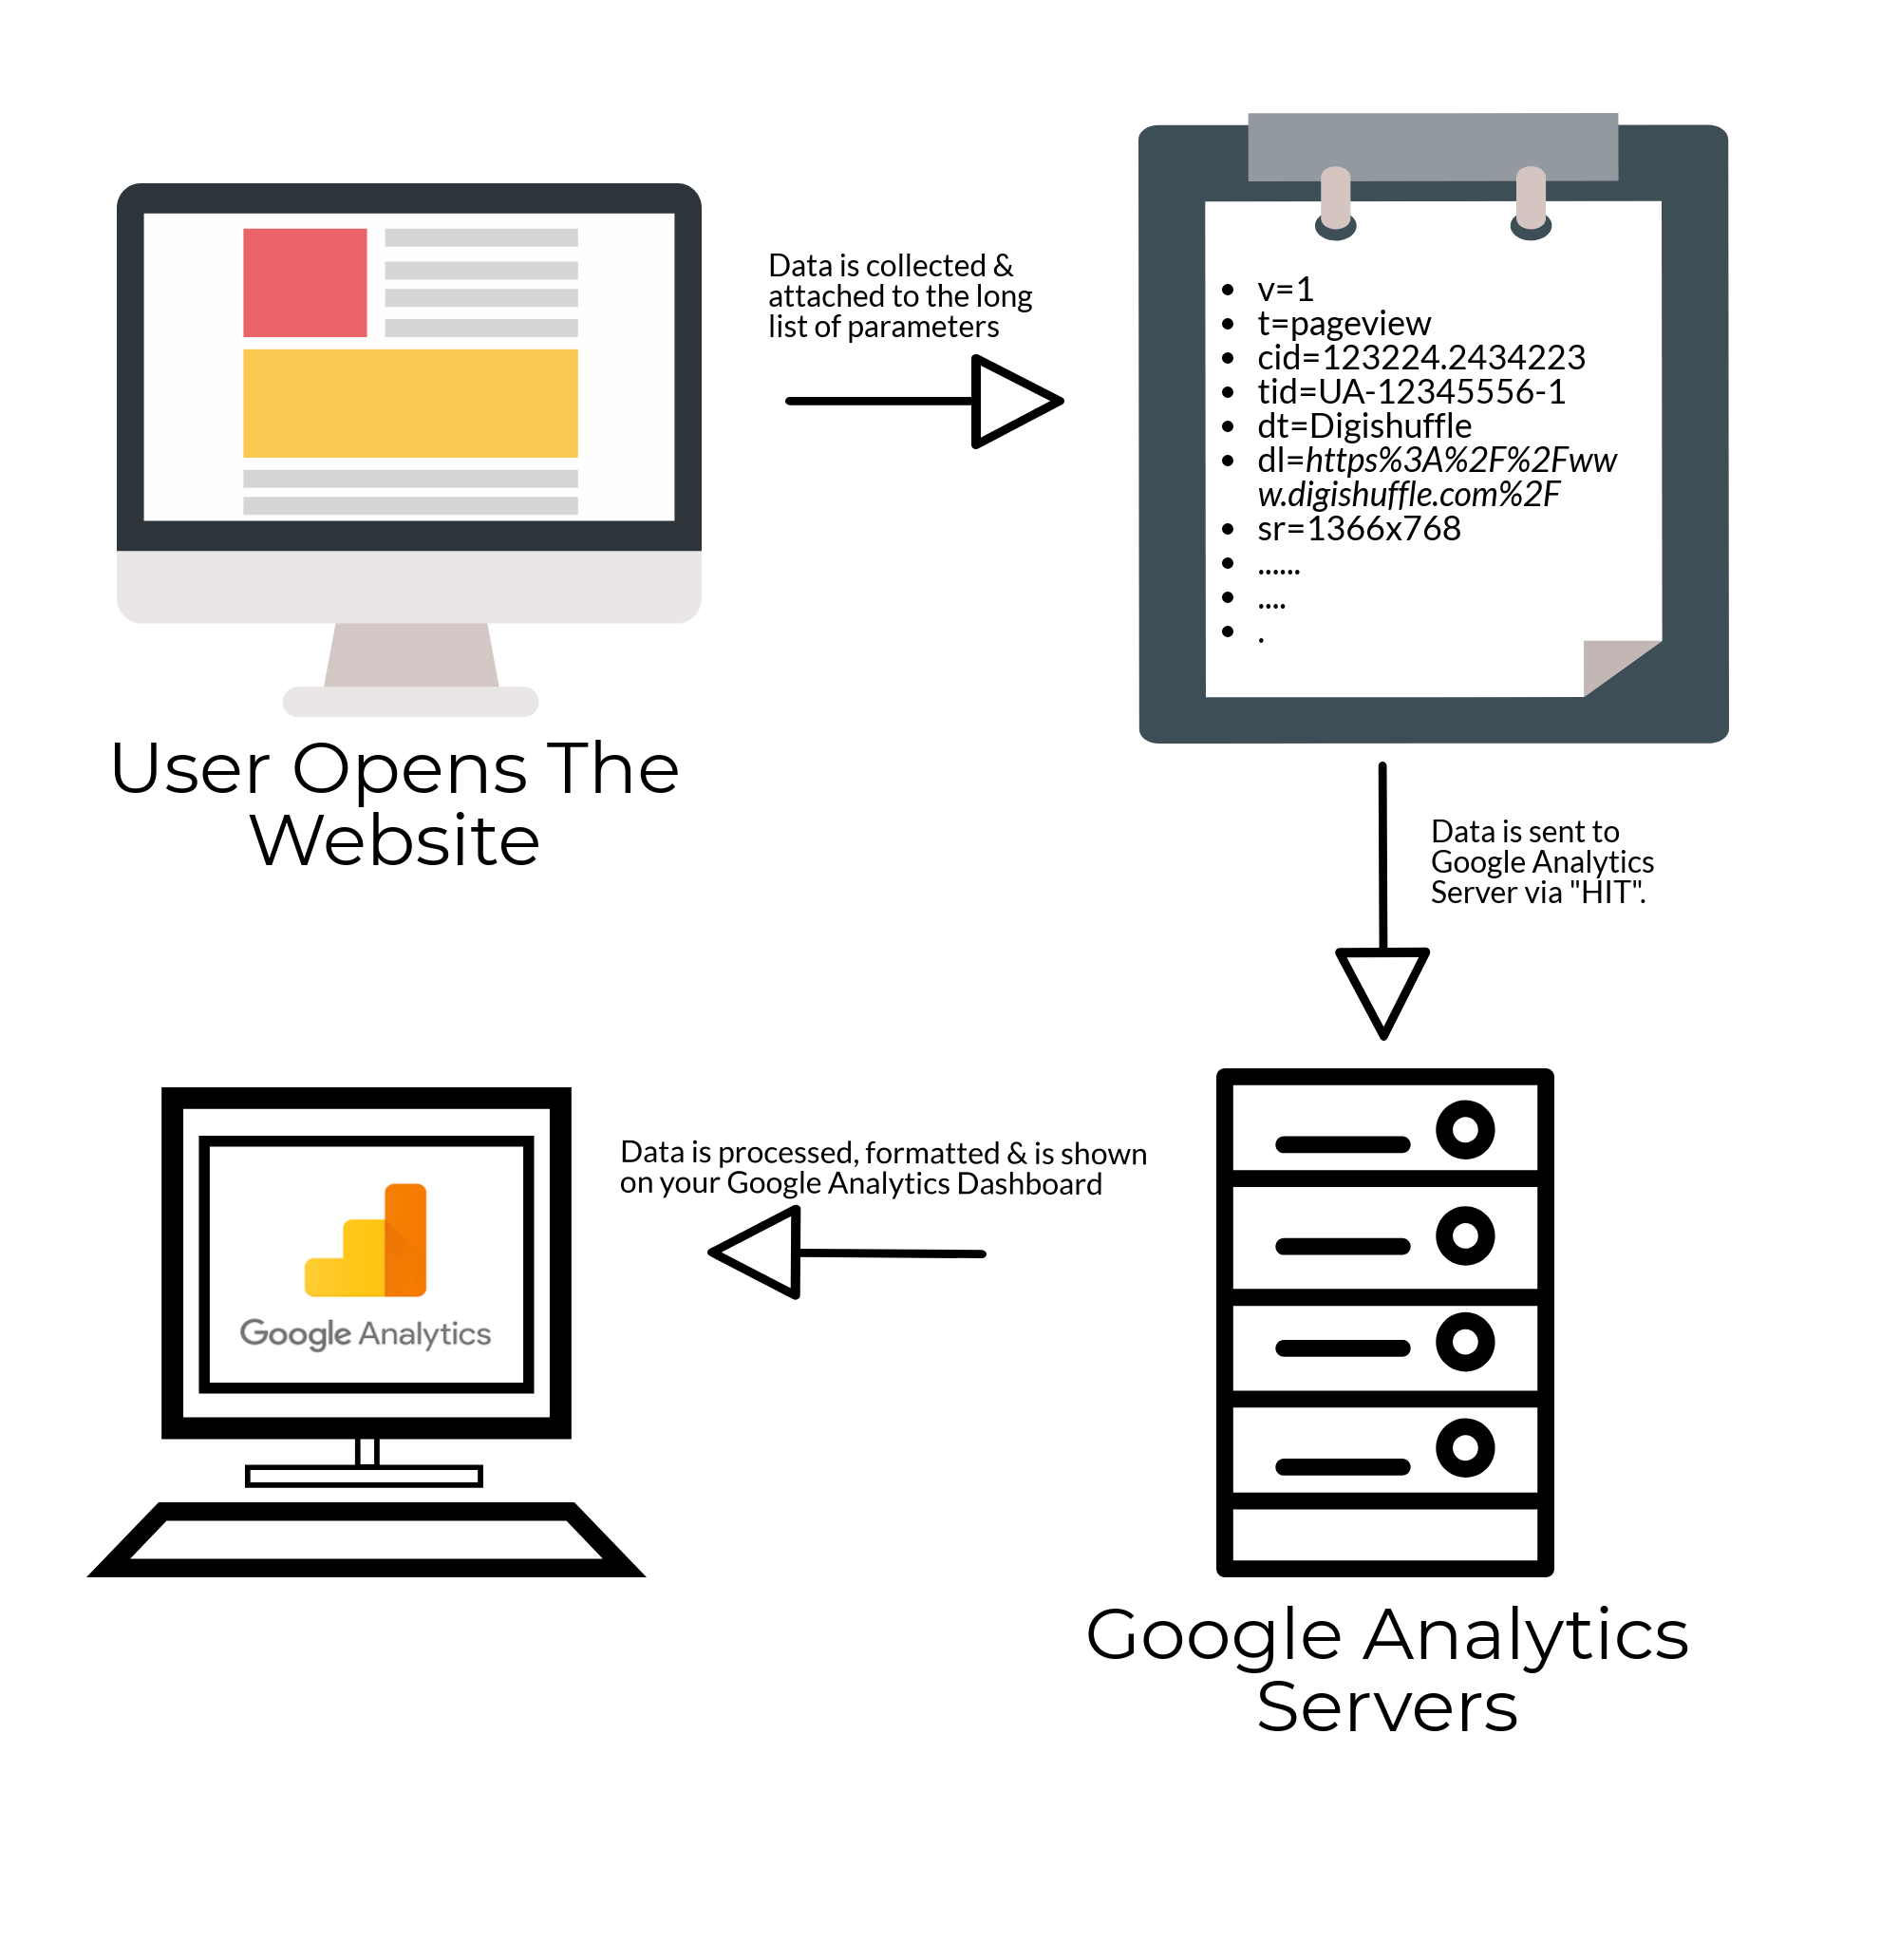
Here’s what going on…
1.) The analytics code on your website gets triggered on page load.
The main sources from where the google analytics tracking code collects data are
- The HTTP request of the user
- Information Gathered: Hostname, referrer, browser language, etc
- Browser/system information
- Information Gathered: Java & Flash support, Screen Resolution, etc
- First-party cookies
- Information Gathered: Sessions, Source/Medium, etc
- DoubleClick cookies. (only when display features are enabled)
- Information Gathered: Demographics, Interests, etc
2.) The Data gathered is sent to Google Analytics Servers via a Hit.
This collected information is sent to the Google Analytics servers in the form of a long list of parameters attached to a single-pixel GIF image request.
Here’s what it looks like:
https://www.google-analytics.com/r/collect?v=1&_v=j72&a=834238095&t=pageview&_s=1&dl=https%3A%2F%2Fwww.digishuffle.com%2Ftesting-page%2F&ul=en-gb&de=UTF-8&dt=Testing%20Page%20-%20Digishuffle&sd=24-bit&sr=1366×768&vp=1499×427&je=0&_u=SCCAAAADQ~&jid=1526552845&gjid=2113202529&cid=1885418923.1520692526&tid=UA-89611791-1&_gid=1918538701.1543666955&_r=1>m=2wgbc0K69QHW7&z=608482186
This data is sent to the Google Analytics servers, which is processed & later available in your reports.
What are the Different Types Of Hits?
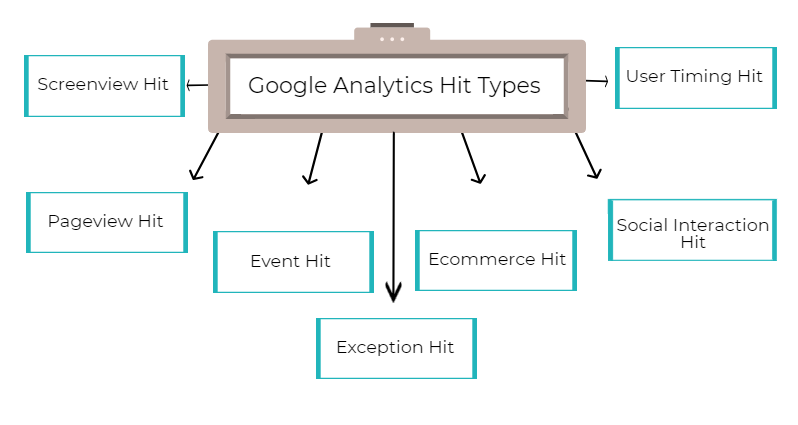
Different types of hits will send different types of data (some overlapping), populating different reports on Google Analytics. These are the types of hits available in GA:
- Pageview hit
- Screenview Hit
- Event Hit
- Social Interaction Hit
- Ecommerce Hit
- User Timing Hits
- Exception Hit
Again, some of these are subcategorized into 2 types
- Interaction Hit
- Non-Interaction Hit
By default most of the hits are interaction hits, i.e Google Analytics will use these hits to calculate engagement metrics such as avg. time on page, bounce rate & so on…
To make a hit a Non-Interaction one, you’ll need to add set the event “non-interaction == true” (in GTM). If you are not using GTM, then just add the non-interaction parameter as below.
[crayon-5f7eff108bb27207153921/]
[crayon-5f7eff108bb33582329395/]
What Interaction Data is sent via Different Types of Hits?
Pageview Hit:
By default, only the pageview hit data gets sent on every page load by the user. The easiest way to see the data is to open the chrome debugger network request & search for collect request
Data Sent: (* marked are a compulsory parameter)
| Variable | Data | Explanation |
| v | 1 | Protocol version* |
| tid | UA-12344523-1 | Property ID* |
| cid | 123453443.214124124 | Client ID* |
| t | pageview | Hit Type* |
| dl | https://www.digishuffle.com/ | document location* |
| dt | Digishuffle – Page Title | document title |
| …… | …… | Other Browser Variables |
| … | … | Other Browser Variables |
Dimensions & Metrics Populated:
- Users
- Sessions
- Pageviews
- Page URL
- Page Title
- Screen Resolution
- Browser Language
- Operating System
- … etc etc
Screenview Hit (for Apps):
If you have installed google analytics setup in your app, then the screenview hit will send the following data to the servers.
Data Sent: (* marked are a compulsory parameter)
| Variable | Data | Explanation |
| v | 1 | Protocol version* |
| tid | UA-12344523-1 | Property ID* |
| cid | 123453443.214124124 | Client ID* |
| t | screenview | Hit Type* |
| an | Calculator | App Name |
| av | 2.0.0 | App Version |
| aid | com.calc.app | App Id |
| aiid | com.vending.android | App Installer ID |
| cd | home | Screen name |
Dimensions & Metrics Populated:
- Users
- Sessions
- Screen Views
- Unique Screen Views
- Screens / Session
- Screen Name
- App Name
- App Version
- App ID
- App Installer ID
Event Hit:
To send an event hit, you’ll need to implement custom coding. Also, it’ll depend on what you are using to fire analytics tags (GTM or analytics.js/gtag.js).
If you’re using GTM, you can create a universal analytics event tag to send an event hit.
The reports are available in the Behavior > Events > Top events section.
Data Sent: (* marked are a compulsory parameter)
| Variable | Data | Explanation |
| v | 1 | Protocol version* |
| tid | UA-12344523-1 | Property ID* |
| cid | 123453443.214124124 | Client ID* |
| t | event | Hit Type* |
| ec | downloads | Event Category* |
| ea | link clicks | Event Action* |
| el | analytics guide | Event Label |
| ev | 100 | Event Value |
Dimensions & Metrics Populated:
- Event Category
- Event Action
- Event Label
- Event Value
- Total Events
- Unique Events
- Event Value
- Avg. Value
Ecommerce Hit:
To clear the confusion, let me iterate something. There are 2 ways to track ecommerce data on your website.
- Enhanced Ecommerce Tracking – Data is sent via pageview or event hit.
- Ecommerce Tracking – Data is sent via ecommerce transaction & item hit.
NOTE: Both cannot be implemented at the same time for the same property.
So, ecommerce hits are only sent when you implement ecommerce tracking & not enhanced ecommerce.
Ecommerce tracking hit simply has 2 sub hit types:
- Transaction hit
- Item hit
Let’s take a look at what data gets sent per hit.
Also, once you enable the ecommerce reports, you will find the data in the Conversion > Ecommerce section.
Data Sent – Transaction Hit: (* marked are a compulsory parameter)
| Variable | Data | Explanation |
| v | 1 | Protocol version* |
| tid | UA-12344523-1 | Property ID* |
| cid | 123453443.214124124 | Client ID* |
| t | transaction | Hit Type* |
| ti | 1001 | Transaction ID* |
| ta | formalShoes | Transaction Affiliation |
| tr | 100.00 | Transaction Revenue |
| ts | 10.00 | Transaction Shipping |
| tt | 5.00 | Transaction Tax |
| cu | USD | Currency Code |
Data Sent – Item Hit: (* marked are a compulsory parameter)
| Variable | Data | Explanation |
| v | 1 | Protocol version* |
| tid | UA-12344523-1 | Property ID* |
| cid | 123453443.214124124 | Client ID* |
| t | item | Hit Type* |
| ti | 1001 | Transaction ID* |
| in | Shoes | Item Name* |
| ip | 100.00 | Item Price |
| iq | 1 | Item Quantity |
| ic | QW12ED | Item Code / SKU |
| iv | shoes | Item Variation / Category |
| cu | USD | Currency Code |
Dimensions & Metrics Populated:
- Transaction ID
- Revenue
- Tax
- Shipping
- Quantity
- Product
- Product SKU
- Product Category
- Unique Purchases
- Product Revenue
- Avg. Price
- Avg. Qty
- etc…
Social Interaction Hit:
These hits will populate the social reports in google analytics (Acquisition > Social > Plugins). These hits also need custom setup & are an option for implementation.
Data Sent: (* marked are a compulsory parameter)
| Variable | Data | Explanation |
| v | 1 | Protocol version* |
| tid | UA-12344523-1 | Property ID* |
| cid | 123453443.214124124 | Client ID* |
| t | social | Hit Type* |
| sa | downloads | Social Action* |
| sn | link clicks | Social Network* |
| st | analytics guide | Social Target* |
Dimensions & Metrics Populated:
- Social Action
- Social Network
- Social Target
User Timing Hit:
These hits will send the timing data to Google analytics. They need custom setup & are an option for implementation.
They will populate the User Timing reports. (Behavior > Site Speed > User Timings)
Data Sent: (* marked are a compulsory parameter)
| Variable | Data | Explanation |
| v | 1 | Protocol version* |
| tid | UA-12344523-1 | Property ID* |
| cid | 123453443.214124124 | Client ID* |
| t | timing | Hit Type* |
| utc | Page Tab Time | User Timing Category* |
| utv | Visible Tab | User Timing Variable* |
| utt | 100 | User Timing Time* |
| utl | /digixport/ | User Timing Label |
Dimensions & Metrics Populated:
- Timing Category
- Timing Variable
- Timing Label
- Avg. User Timing
- User Timing Sample
Exception Hit:
Exception tracking allows you to measure the number & type of crashes/errors that occur on your property. You can learn more about exception tracking via analytics.js here.
Data Sent: (* marked are a compulsory parameter)
| Variable | Data | Explanation |
| v | 1 | Protocol version* |
| tid | UA-12344523-1 | Property ID* |
| cid | 123453443.214124124 | Client ID* |
| t | exception | Hit Type* |
| exd | SyntaxException | Exception Description* |
| exf | 1 | Exception is Fatal?* |
How To View The Hit Data?
The easiest & the most recommended way to look at the data captured by google analytics is from the network tab of your browser.
Let’s look at the practical example. I’ll be opening the test page from my website to see what details are getting captured.
Here’s the screenshot after the page load.

Just filter the request by typing “collect”…
- By default, you can see the GET request containing “t=pageview”, that’s the pageview hit, while other’s are event hit. (need custom setup)
- If you have enabled the remarketing feature in your google analytics, then you’ll see a 302 redirect to “https://stats.g.doubleclick.net/r/collect” which internally redirects (307) to “https://www.google.com/ads/ga-audiences” to fetch the DoubleClick data.
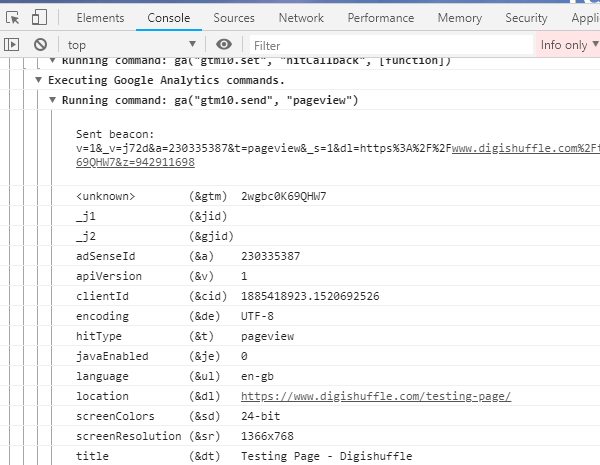
Other great tool is a google analytics debugger add-on. This will give you the detailed hit data information in the browser console.
What are the Hit Limits?
Since Google analytics collects large amounts of data (nearly 500+ dimension & metrics are populated), it does have some limitations. Even some of these limitations are extended to Google Analytics 360.
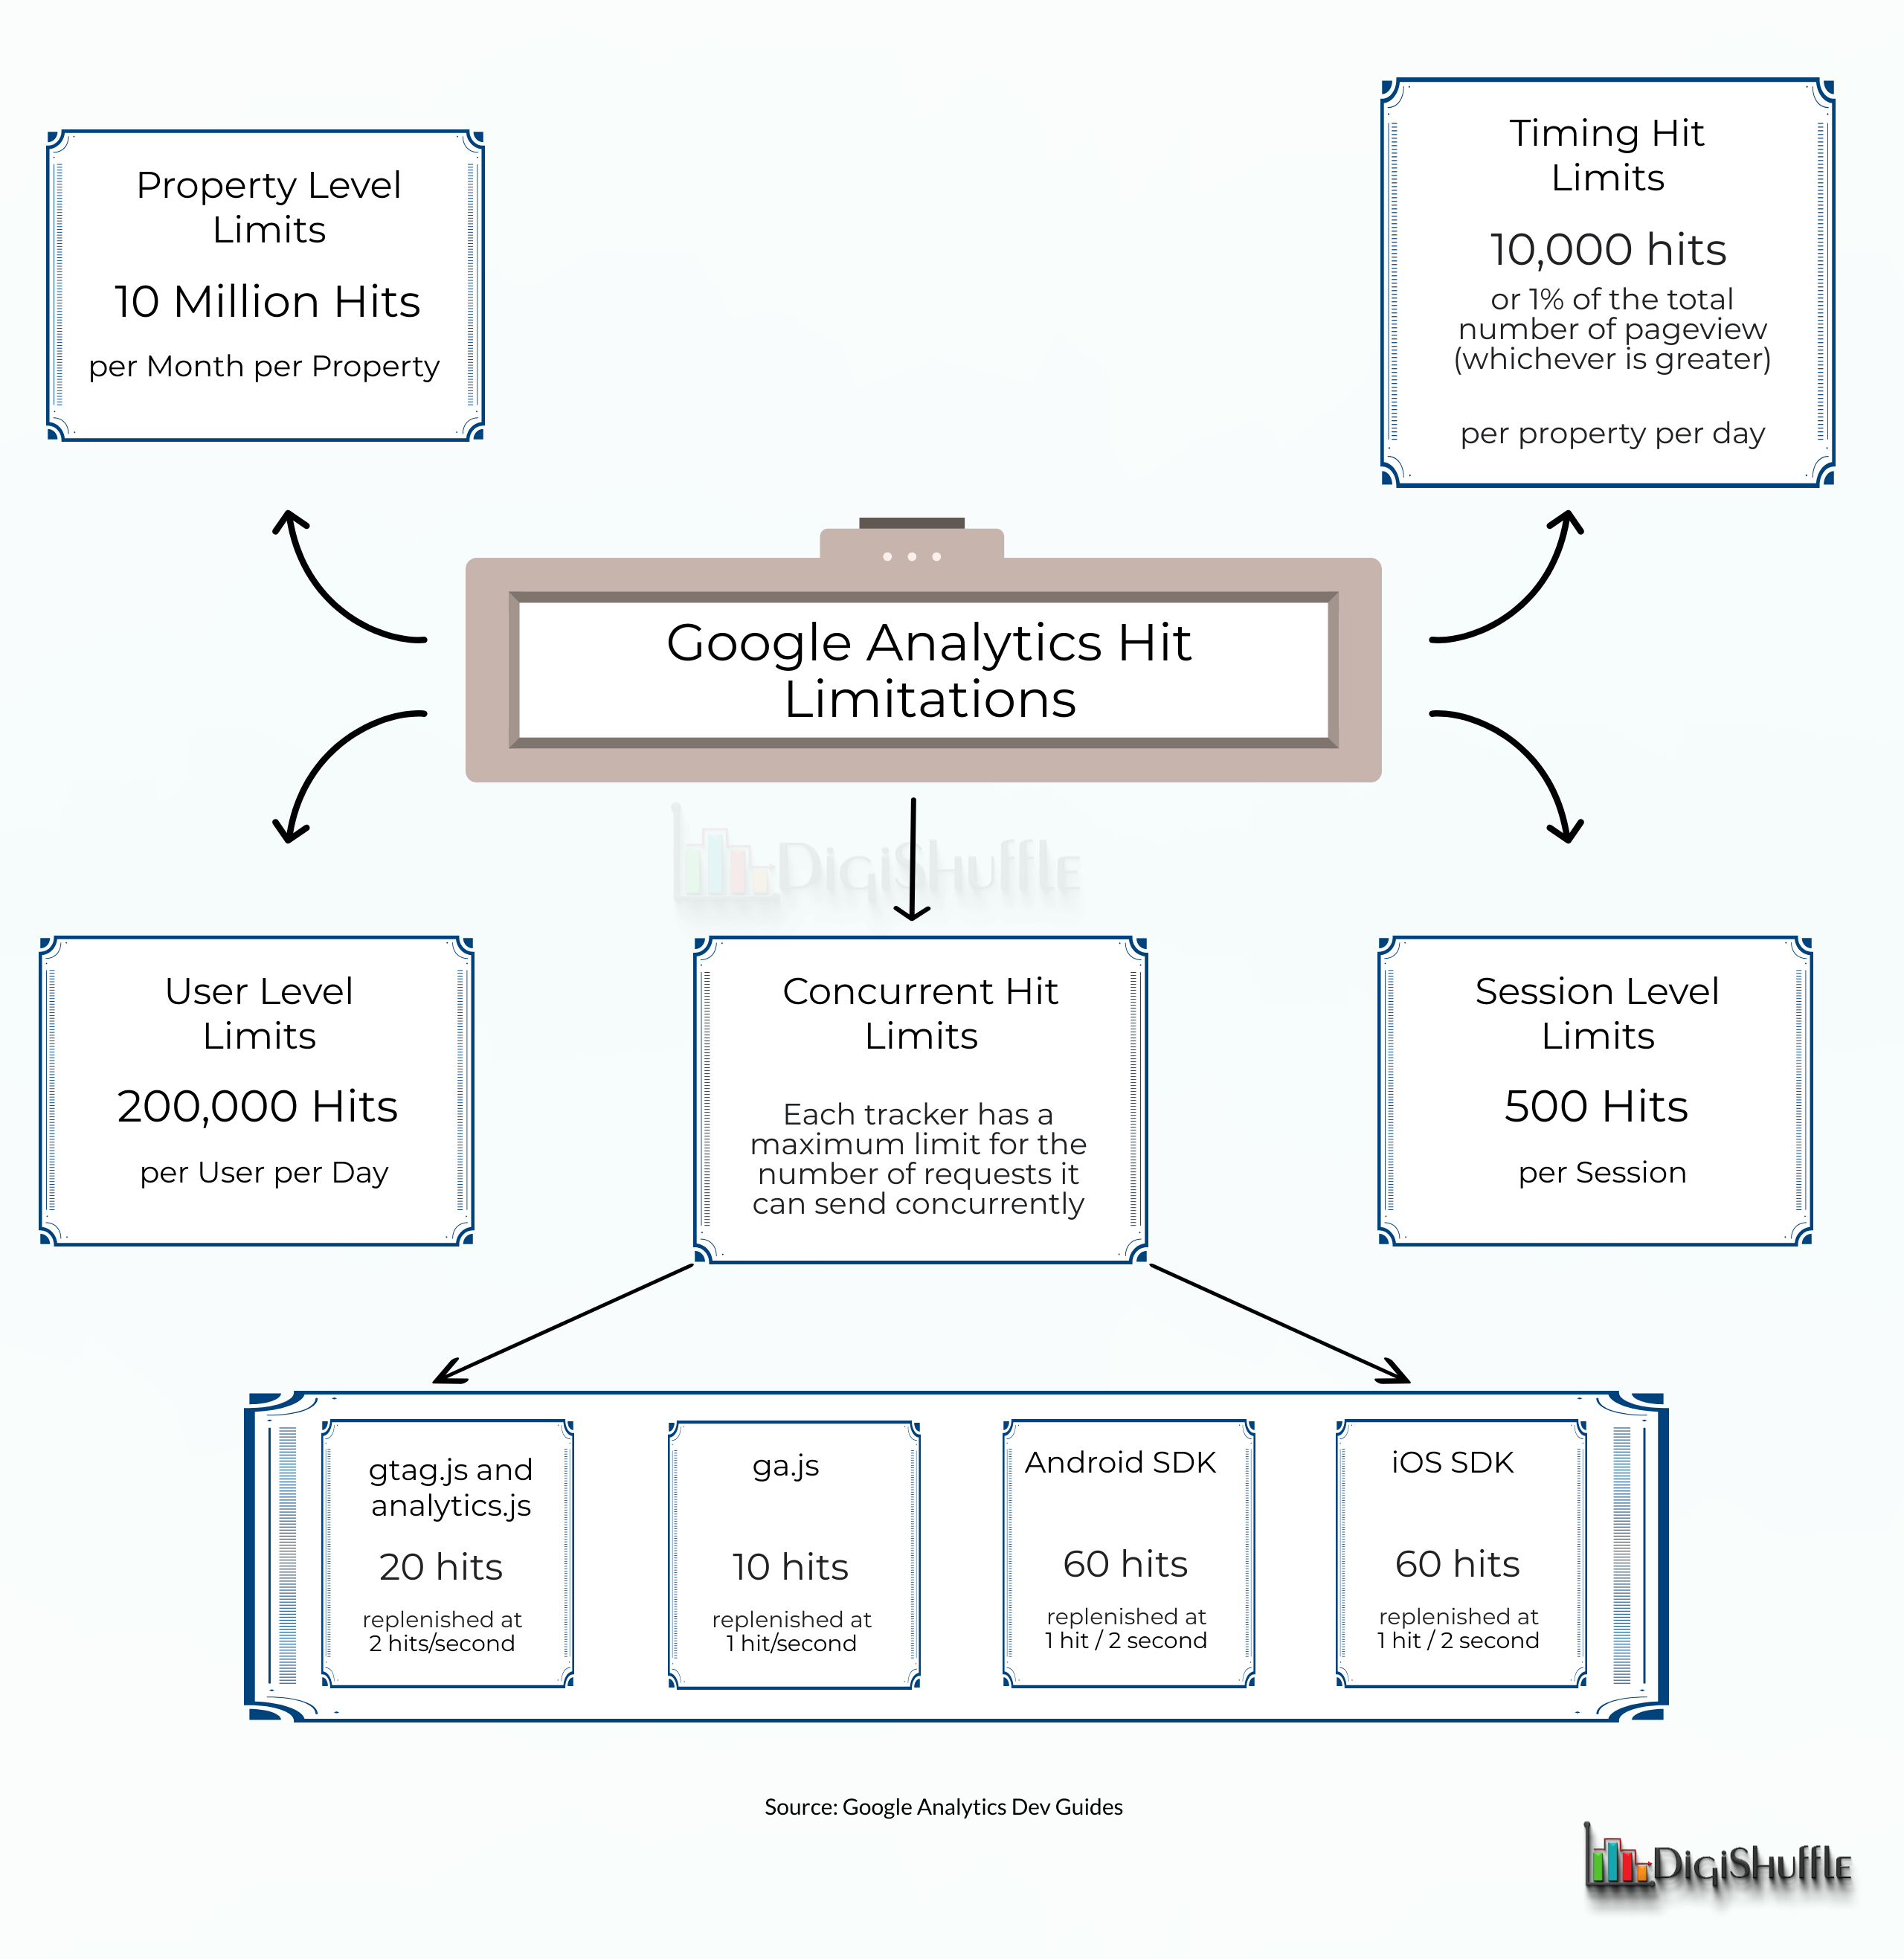
To summarize here’s a great view:
Let’s take a look at it one by one.
Property-Level Limits:
If you are NOT a Google Analytics 360 user, you can process
- 10 million hits / month / property
You’ll receive an email from google if you ever reach that limit to upgrade your account or to sample your data.
User & Session Level Limits:
If you are using gtag.js, analytics.js, Android SDK, iOS SDK or measurement protocol, the limits are as follows:
- 200,000 hits per user per day
- 500 hits per session
If you are using ga.js or any legacy libraries, the limits are as follows:
- 500 hits per session
NOTE: Additional hits will not be processed for any of the above libraries if you go above these limits.
Timing Hit Limits:
The timing hits also include site speed hits (for gtag.js/analytics.js/ga.js). These hits have separate limits as follows.
- 10,000 or 1% of the total number of page views processed (whichever is greater) / Property / Day.
For lower hit counts, limitations are as below:
| Pageviews (Previous Day) | Maximum no of timing hits processed |
| 0 – 1,000 | 100 |
| 1,000 – 100,000 | 10% of the total pageviews |
| 100,000 – 1,000,000 | 10,000 |
| 1,000,000+ | 1% of the total pageviews |
Concurrent Hit Limits:
If you are sending too many hits at once, these are limits imposed for these concurrent hits to prevent the clients from sending data too quickly.
Each library tracker has limits to send data concurrently as follows
- gtag.js & analytics.js – 20 hits / tracker object that are replenished at a rate of 2 hits per second. (except ecommerce hits)
- ga.js – 10 hits / tracker object that are replenished at a rate of 1 hit per second (only event hit)
- Android SDK – 60 hits / app instance that are replenished at a rate of 1 hit every 2 seconds (except ecommerce hits)
- iOS SDK – 60 hits / property that are replenished at a rate of 1 hit every 2 seconds (except ecommerce hits)
To know more, check google limitation docs here.
Where Can I See The Total Hits For My Property & View?
Yes, you can view the total number of hits you’re sending to your property & your view. Here’s how you can do it.
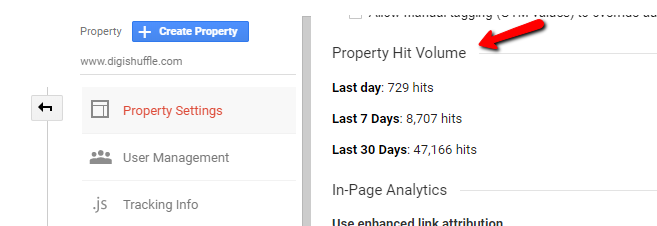
Property Level Hits
- Go To Admin > Select your property > Property settings.
- Go to “Property Hit Volume” Section.
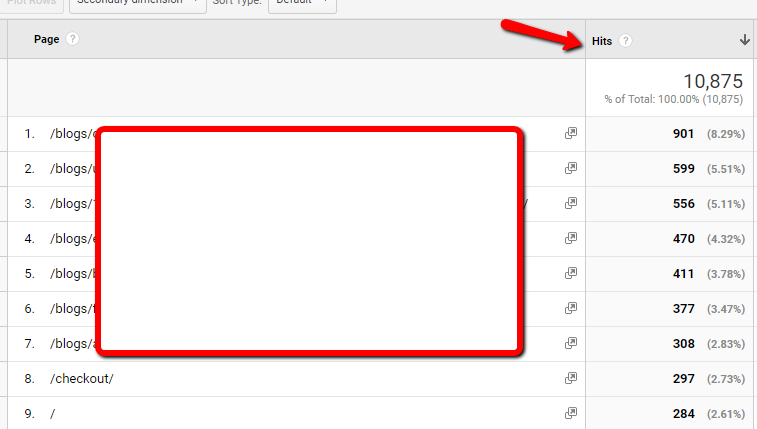
View Level Hits:
- Create a custom report & add “Hits” as a metric with “page” (or any) dimension.
- Here’s you’ll get all the total hit number for the view irrespective of it type.
Confusion Debunked: Hits, Pageviews & Sessions.
Many users get confused between hits, page views, sessions. The better way to visualize it is to try out the google analytics simulation tool.
As we have seen different types of “Hits” send different data to google analytics servers.
Pageviews (or pageview hits) is just the number of pageview hits sent for a particular page. So, basically it is just a subset of all hit types.
Sessions are the group of user interactions (or hits) with your website that takes place within a given time frame.
To know more of these differences, I would highly suggest you to check out this article related to pageviews vs sessions vs users.
Final Thoughts
You can try checking the hit data for various other sites too. This will give you an idea what all things they are tracking & you should too.
This open nature of google analytics data collection via measurement protocol also has a negative effect like spam hits data or insecurity for data transfer. This is the reason why large companies like Amazon, eBay, target prefer adobe analytics or their own internal analytics tracking setup.
Most analytics tools define their pricing based on the number of hits you’re sending to their servers. So based on your requirement you can choose what all data to track.
For now, I hope you can now understand & debug your tracking in a better way than before. Let me know if you have any issues while debugging your hits.
