Last Updated on October 30, 2019 by Ritwik B
In this article, we’ll be looking at the benchmarks of some of the most important web analytics metrics.
These metrics are well-known engagement metrics… They are
We’ll be breaking down these metrics by various dimensions such as different industry type, website traffic, country, channel, device & more…
That’ll help you understand the benchmark trends for these metrics across all these dimensions.
Now, Let’s get down to the reports.
Index
Website Traffic Benchmarks 2018
Learnings
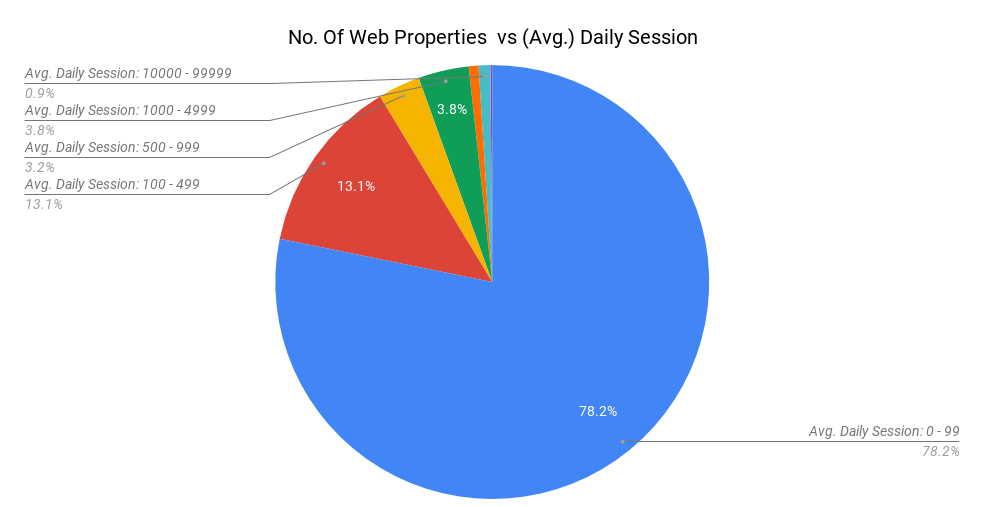
- Out of the total of 4,23,344 web properties (websites) that contributed to the benchmarks,
- Nearly 78.2% of those have ~ 0 – 99 (avg.) daily sessions.
- 13.10% of those have 100 – 499 (avg.) daily sessions.
- 3.2% of those have 500 – 999 (avg.) daily sessions.
- 3.8% of those have 1000 – 4999 (avg.) daily sessions.
- 0.9% of those have 10000 – 99999 (avg.) daily sessions
- 0.13% of those have 100000+ (avg.) daily sessions
Learnings
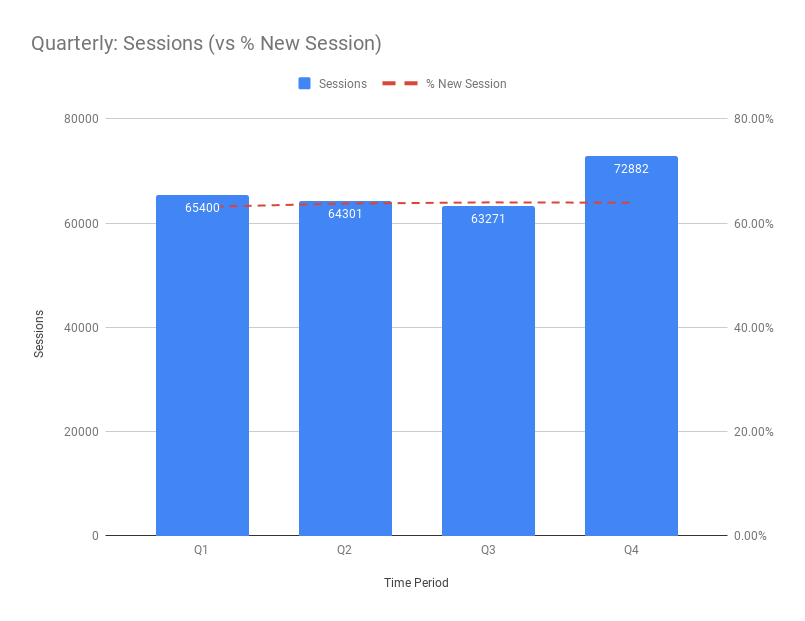
- For the shopping category, we observe that there’s a huge traffic rise around the Q4 while it dips in Q3. While the % new sessions more or less remains the same across the year which is around ~ 63.72%.
- The benchmark sessions for the different quarters were as follows
- Q1: 65,400
- Q2: 64,301
- Q3: 63,271
- Q4: 72,882
Learnings
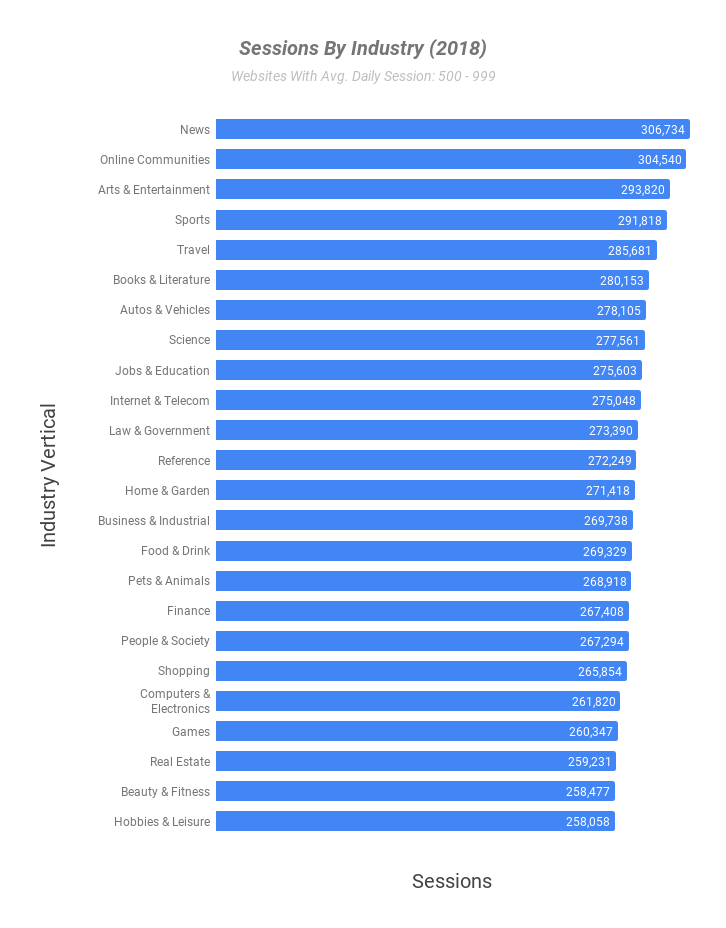
- Out of all the web properties in the 500 – 999 avg. daily session range, we observe that
- The Industry Category recieving the most traffic is News & Online Communities.
- The Industry Category recieving the least traffic is Hobbies & Leisure.
Bounce Rate Benchmarks 2018
Learnings
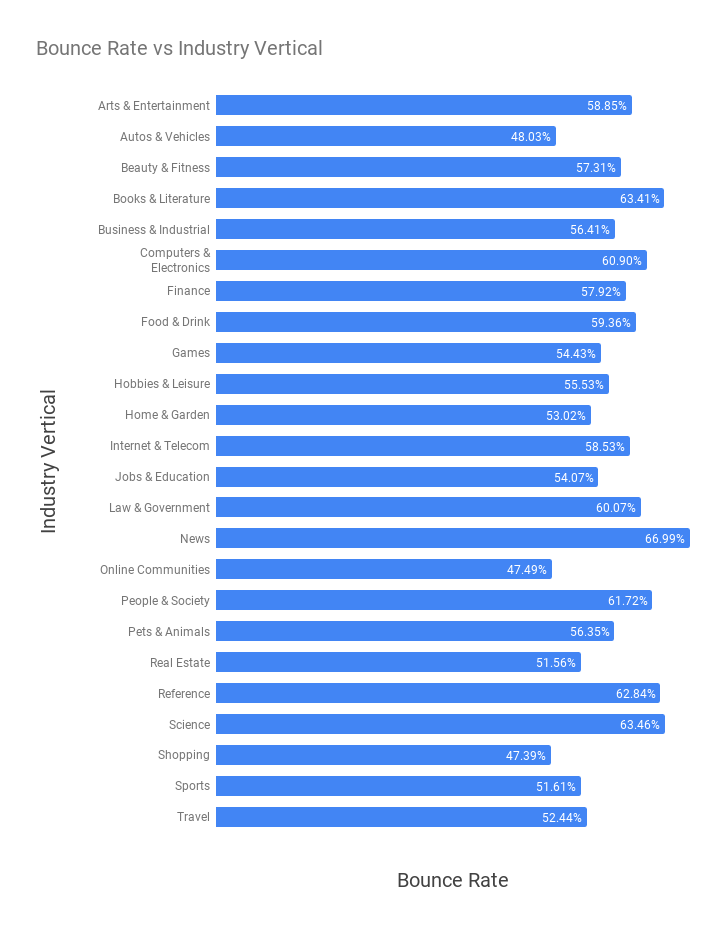
- The shopping category has the LOWEST bounce rate of 47.39%. While the HIGHEST bounce rate is for the News category, which is 66.99 %. It is quite obvious that the intent of users is different.
- Other industry verticals at the lower end of the spectrum are
- Online Communities (47.49%)
- Autos & Vehicles (48.03%)
- Real Estate (51.56%)
- Sports (51.61%)
- Travel (52.44%)
- Other industry verticals at the higher end of the spectrum are
- Science (63.46%)
- Books & Literature (63.41%)
- Reference (62.84%)
- People & Society (61.72%)
- Computer & Electronics (60.90%)
Learnings
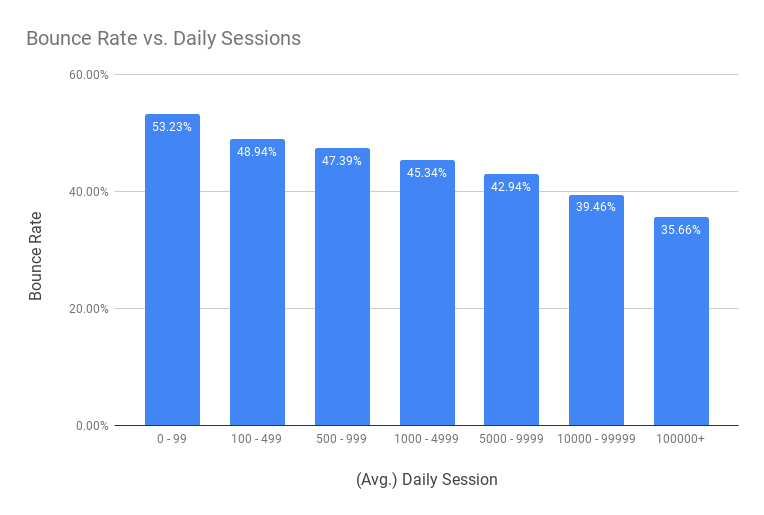
We broke down the bounce rates by avg. daily sessions the businesses receive. Here’s what we got:
- The websites having Low traffic generally have low bounce rates as compared to sites having high traffic.
- Websites with avg. daily session of 0 – 99 have bounce rate ~53.23% while sites with avg. daily session of 100k+ have bounce rate ~35.66%
Learnings
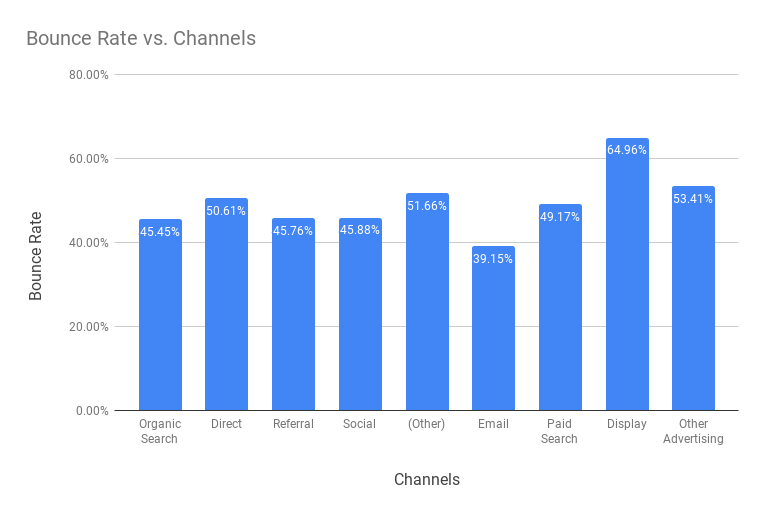
Here, we’ve broken down the bounce rates by default channel grouping.
- As expected, the Display has the highest bounce rate of 64.96% as compared to other channels while the Email has the lowest bounce rate of 39.15%.
- Organic, Referral & Social Channels have bounce rates in the range of ~ 45-46% while paid search is slightly higher at ~49%
Learnings
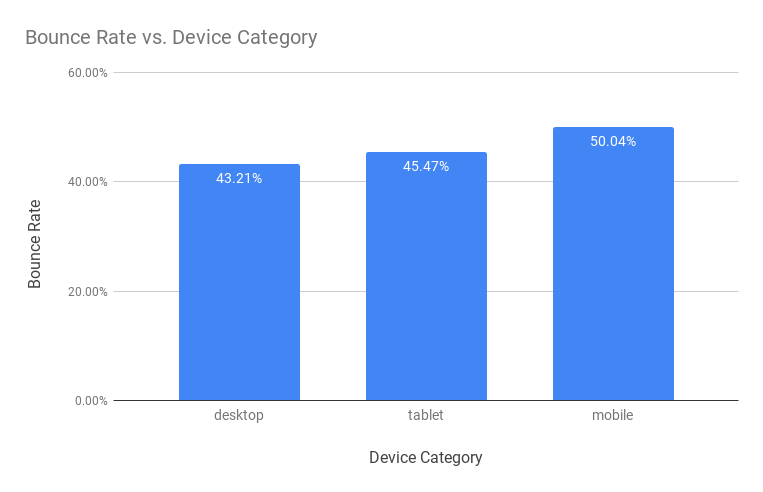
- In spite of the growth in mobile users, it has the highest bounce rate of 50.04% as compared to other devices.
- The desktop has the lowest bounce rate of 43.21%.
Avg. Session Duration/Time On Site Benchmarks
Learnings
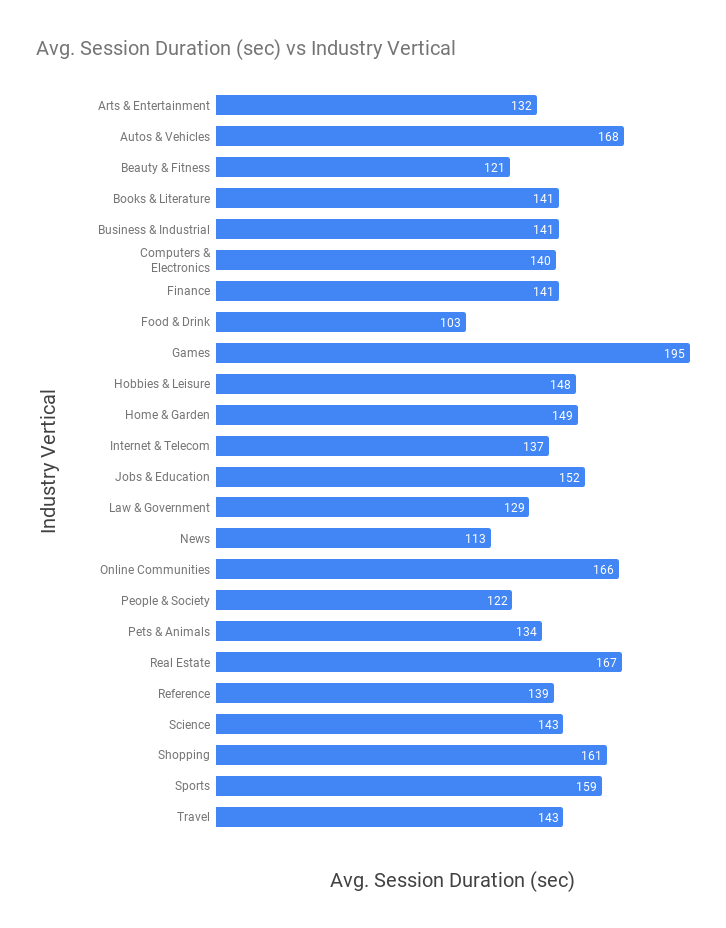
- Gaming category has the highest avg. session duration of around ~ 3 min 15 sec as compared to others.
- Other categories that fall in the HIGHER avg. session duration range are:
- Autos & Vehicles.
- Real Estate.
- Online Communities.
- Shopping
- Sports
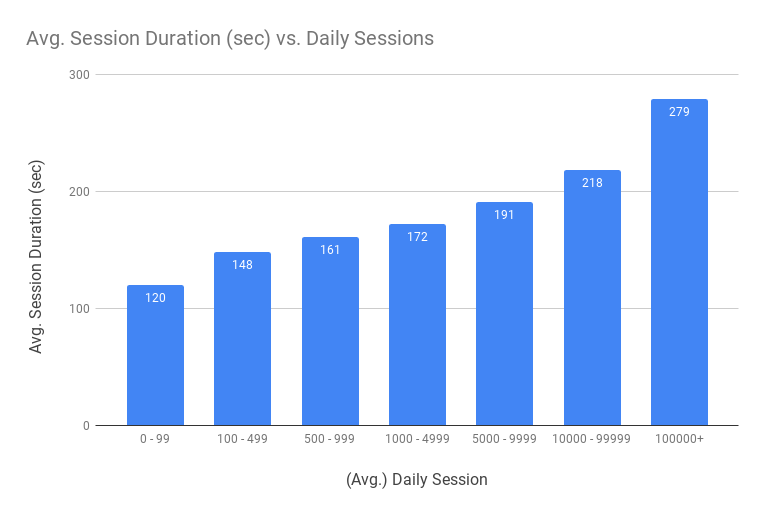
Learnings
- Websites having higher avg. daily sessions have higher avg. session duration & vice-versa.
- If you observe a similar graph for bounce rate, you’ll find that avg. session duration negatively correlates with bounce rates.
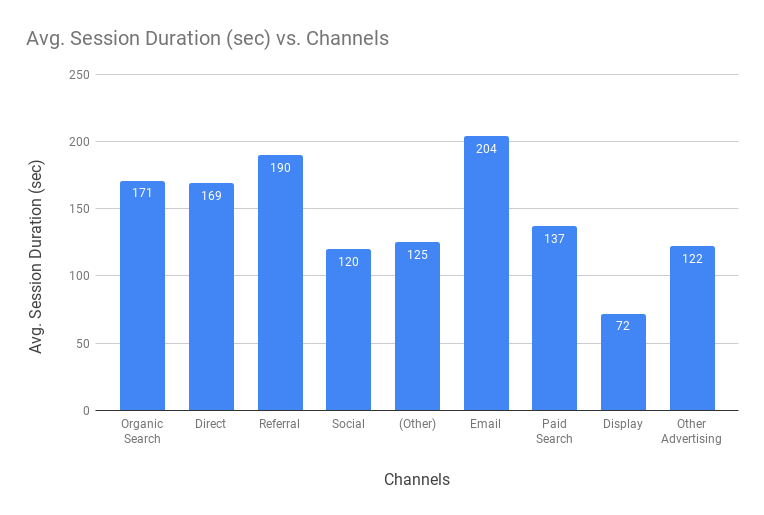
Learnings
- Email channel has the highest session duration of 3 min 24 sec as compares to other channels.
- The lowest engagement channel is Display with 1min 12 sec. avg. session duration as its one of the push marketing strategy & lacks user intent.
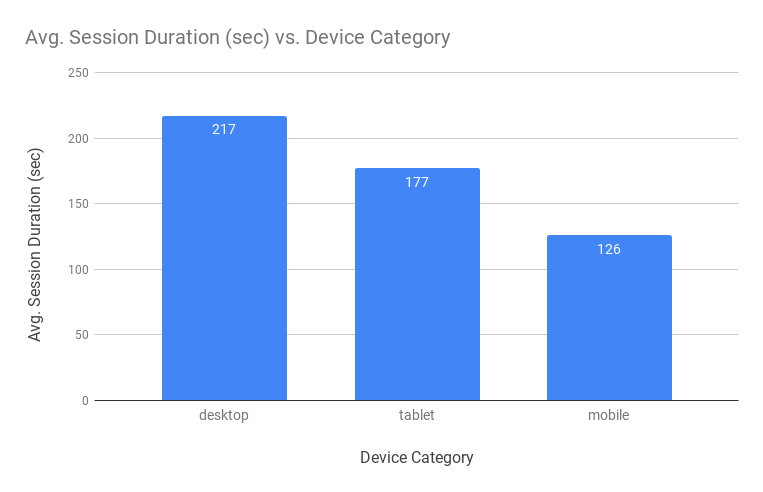
Learnings
- Among the devices, the desktop has the highest avg. session duration of 3 min 37 sec.
- While the mobile has the least avg. session duration of around ~2 min 6 sec.
Sources
The stats are based on google’s benchmarking reports. These reports compare the data with other businesses within your industry who share the data anonymously with google.
As per google,
Benchmark reports provide valuable context, helping you to set meaningful targets, gain insight into trends occurring across your industry, and find out how you are doing compared to your competition.
Sample Size: The report is based on 10k+ web properties in google analytics.
Date Range: 2018 Year