Bounce Rate Bible: Bounce Rate vs Exit Rate [In-Depth Guide]

Bounce Rate vs Exit Rate - Digishuffle

Many users get confused when we talk about Bounce Rates & Exit Rates. Well, this is normal..!! 

You might think that if you have higher bounces & exits, your website SUCKS..!!! Now that might not be always a correct assumption, as it lacks context & understanding how google analytics calculates these metrics.

So, let’s dive deep into the bounce rate vs exit rate comparison.

Say, 2 people are having a conversation.

Mr A: “I have a High Bounce Rate & High Exit Rate” 
 
Mr B: “I have Low Bounce Rate & Low Exit Rate
 
Guess, Whose website is Better?
 
A’s ? B’s ?
 
Short Answer: We Don’t Know.
 
The most important thing in web analytics is to understand the ‘context’.
 
Never take decisions based on a single datapoint.
 
We don’t know what pages are they talking about?, what was the traffic source? & so on..
 
As discussed in how to reduce high bounce rates, there might be as case where you are running display campaign with 80-90% bounce rates. (which is quite normal)
 
Later, you would be running brand search campaigns having 40-50% bounce rates. 
 
And at the end of the month you look at the report which shows 60-70% Overall Bounce Rate. (which includes 100s of different campaigns with different goals you ran last month)
 
High Bounce Rates are not always Bad & The same goes with High Exit Rates
 
Also both these metrics are nowhere related to each other.
 
If you are using Google Analytics, Let’s first understand

How is Bounce Rate & Exit Rate Calculated By Google Analytics?

As per google docs,
 
Exit Rate is the percentage pageviews that were the last in the session.
 
Bounce Rate is the percentage of the single sessions. 
 
Sometimes, that might be confusing. So, here’s the formula used by Google Analytics for calculating Bounce Rate & Exit Rate.
 
Bounce Rate = Bounces  / Sessions
 
Exit Rate = Exits / (Pageviews + Screenviews)
 
 
Remember, these metrics tell nothing about the ‘Users’. (more later)
 
Let’s understand

How is Bounce Rate different from the Exit Rate in Google Analytics?

Notice the formula for ‘Bounce rate‘ contains Session level metrics like ‘Bounce’ & ‘Session’ while the ‘Exit Rate’ has Session level metric ‘Exits’ & Hit level Metric ‘Pageviews’
 
That makes a lot of difference.
 
Let’s first understand EXIT RATE.
 
A simplest example,
 
Scenario 1:
User Lands on the page & Refreshes it & exits:
Path: Page A > Page A (Exit)
 
Result: 
Bounce Rate: Bounces / Sessions = 0 / 1 = 0%.
Exit Rate: Exits / Pageviews = 1 / 2 = 50%
 
 
Scenario 2:
Now the user refreshes it again:
Path: Page A > Page A > Page A (Exit)
 
Result:
Bounce Rate: Bounces / Sessions = 0 / 1 = 0%.
Exit Rate: Exits / Pageviews = 1 / 3 = 33.33%
 
 
Scenario 3:
2 Users visit some pages & exit via same page:
 
User 1 Path: Page A > Page B > Page A > Page B > Page A (Exit)
User 2 Path: Page B > Page A > Page A > Page B > Page A (Exit)
 
Result:
Bounce Rate: Bounces / Sessions = 0 / 2 = 0%.
Exit Rate: Exits / Pageviews = 2 / 6 = 33.33%
 
 
Notice How the Exit Rate of a page decreases as the user visits the same pages many times in a session.
 
So, if you have an ecommerce store where a users shifts back & forth from product to product (Product Comparison)& exits from one of the product page, you’ll have low exit rates for that page.
Now, Lets understand BOUNCE RATE
 
Scenario 1:
User Lands on the page & exits:
Path: Page A (Exit)
Result: 
Bounce Rate: Bounces / Sessions = 1 / 1 = 100%.
Exit Rate: Exits / Pageviews = 1 / 1 = 100%
 
Scenario 2:
2 User Lands on the page & exits:
User 1 – Path: Page A (Exit)
User 2 – Path: Page A (Exit)
Result: 
Bounce Rate: Bounces / Sessions = 2 / 2 = 100%.
Exit Rate: Exits / Pageviews = 2 / 2 = 100%
 
 
Scenario 2:
2 User Lands on 2 different pages & exits:
User 1 – Path: Page A (Exit)
User 2 – Path: Page B (Exit)
Result: 
Bounce Rate (Page A OR B): Bounces / Sessions = 1 / 1 = 100%.
Exit Rate (Page A OR B): Exits / Pageviews = 1 / 1 = 100%
 
 
Always Remember that for the bounced sessions there is always 100% exit rate
 
So high bounce rate pretty much will increase you exit rate. (If non-bounced visits have less page / sessions)
 
Let’s create custom report to understand these metrics 

Understanding Bounce Rate vs Exit Rate in Detail via Custom Reports
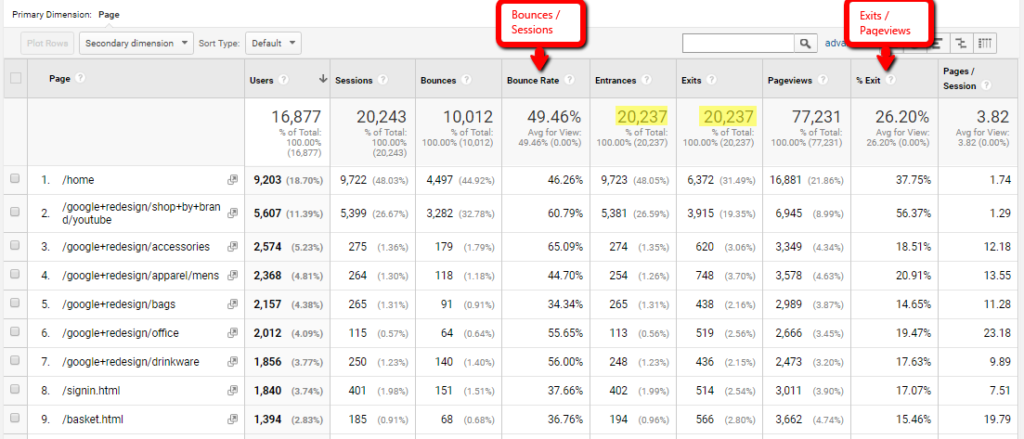
Bounce_Rate_vs_Exit_Rates_-_Digishuffle
  • When the user enters your website he/she has to leave via some page. So the Total Entrances = Total Exits.
  • The 2nd Row Page has High Exit Rate ‘56.37%’ because it has High Bounce Rate & less Pages / Sessions
  • The 3rd Row Page has Low Exit Rate ‘18.51%’ (inspite of high bounce rate) because of High Pages Per Sessions
 
You can see how high bounce rates can affect the exit rates. The problem here is, the %exit also contains bounced ‘exits & pageviews’ as seen above.
 
There is a different reasons for someone who bounced from the home page & someone who exited from addtocart page. 
 
Exit Rate is actually = Bounce Exits + Non-Bounced Exits / Bounce Pageviews + Non-Bounced Pageviews.
 
To find the real %exits of the engaged users (1+ pageview users), we need to separate them. 
 
Now is the time for some segment analysis.

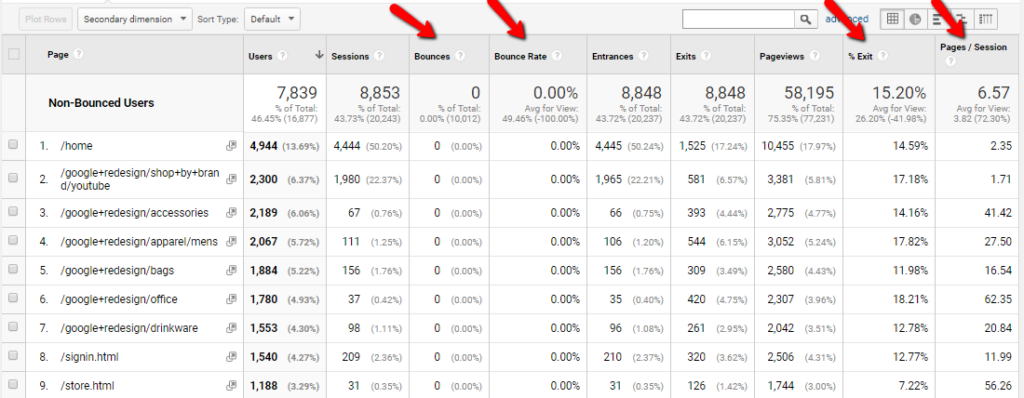
Segment By Non-Bounced Users.

Non-Bouned Users - Exit Rate vs Bounce Rate - Digishuffle
  •  Notice How The %Exit has now decreased when we exclude bounced visits.
  • You can now analyze the pages with high exit rates.

Simply check comparison reports
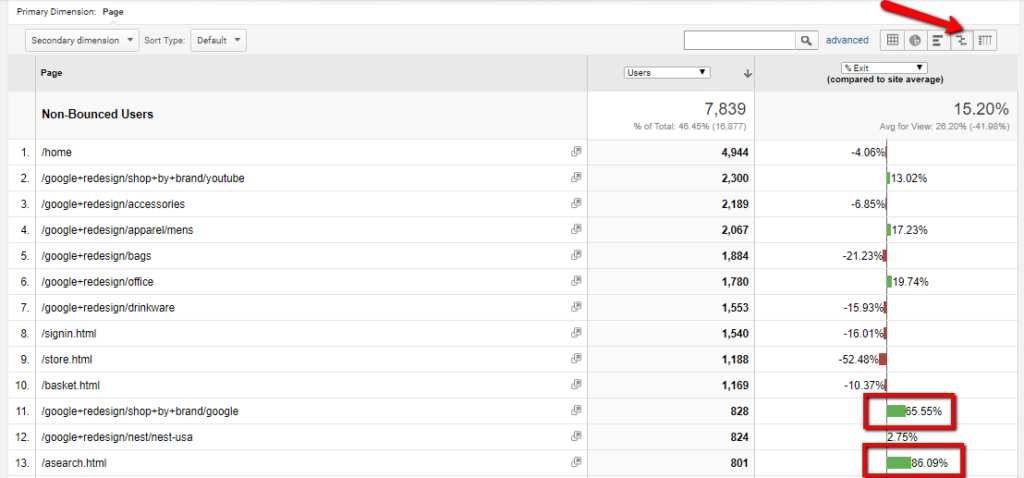
Exit Rates vs Bounce Rate - Digishuffle
  • You can identify the pages with high exits rate & go through visitor recordings usign tools like hotjar, fullstory, inspectlet, etc
  • In the above example, we see ‘asearch’ page(assuming search result page) has high exits. You can then check the site search report for furthur details.
  • Also, some category page ‘shop+by+brand/google’ has high exits. You can then check if there are less products in the category & so on. 
 
Another great approach is to Segment by User Type

Segment By User Type - New Users (Non-Bounced)

By isolating the new user segment with bounced visit, we can focus on the new user who engaged & dropped off from the funnel.

This will help in optimizing UX for new users.

Use the same comparison reports to find the high % exit pages.
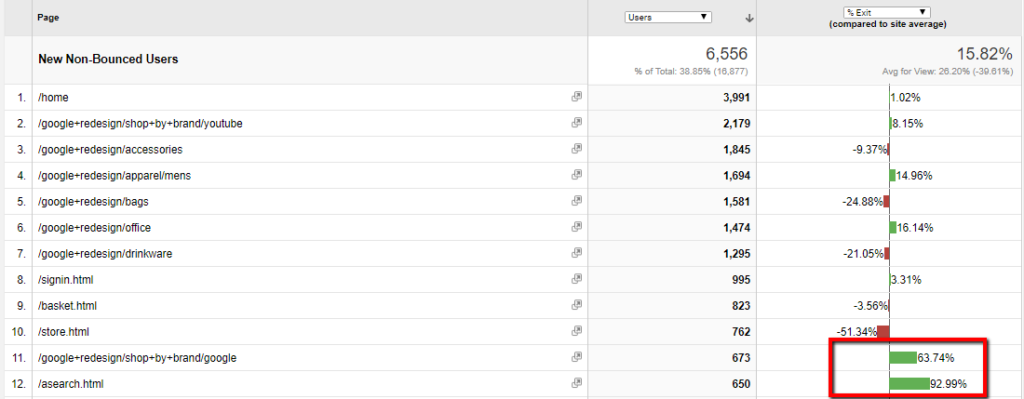
Exit Rate vs Bounce Rate - Segmentation_NonBounced Users - Digishuffle

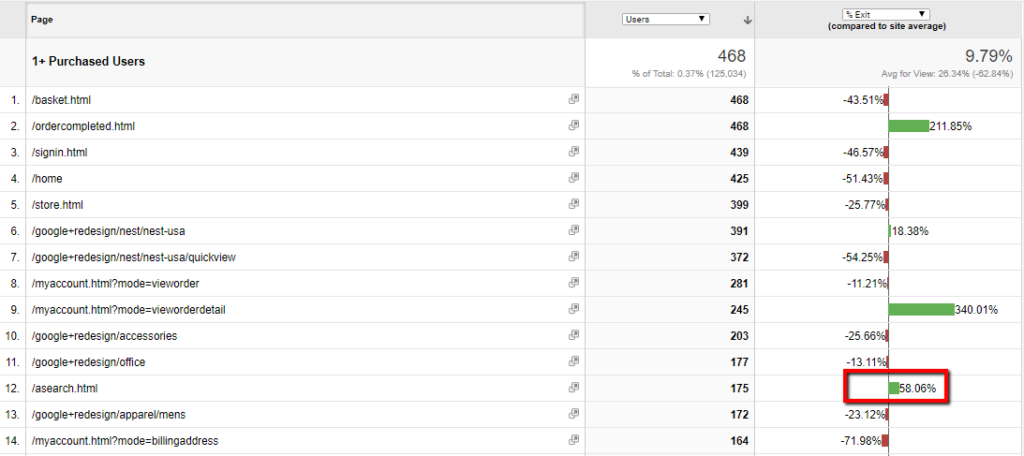
Segment By Loyal Users

Loyal users are those users having high LTV. These are the users who will decide the fate of your business. 

You can create this segments with the following conditions. (depending on your business)

  • Transactions > 1
  • Revenue > X$


Loyal Users - Exit Rate vs Bounce Rate - Digishuffle
  • You can see the higher exits on the ‘ordercompleted’ page which is quite normal.
  • But higher exits ‘asearch’ (Search results) page needs to be optimized.
 
Other segments you can try are
  • Device
  • Country (International wesbites)
  • Browser
  • Channels

Learnings

  • High Bounce Rates & High Exit Rates are normal in some cases.
  • High Bounce Rate will lead to High Exit Rates for a particular page. (Only If non-bounced users have low pages/session)
  • Use Non-Bounced User Segment To Get Real High % Exits for the pages.
  • Focus on Loyal User Segment to find any UX issues as they are high priority users.
  • Use Visitor Recording Tools to debug the high exit pages.


Lastly feel free to comment & share with your friends/colleagues.
Ritwik is a product owner at DigiXport. He also loves to write technical & easy to understand blogs for Marketers & Entrepreneurs. A Firm Believer in Teaching -> Learning -> Growing. :)

Leave a Reply

Your email address will not be published. Required fields are marked *