There has been a lot of discrepancy between the Bounce Rate Benchmarks as defined by various companies & the ones defined in Google Analytics Benchmarks Reports.
Its because of the differences in the sample size & their characteristics. (& calculation methods)
So, I have decided to list down the companies that performed the research, the sample size & Date range on which the bounce rate benchmarks are based.
That’ll give you a clear picture of the bounce rates across industries.
Feel free to jump to any desired section.
Bounce Rate By Industry
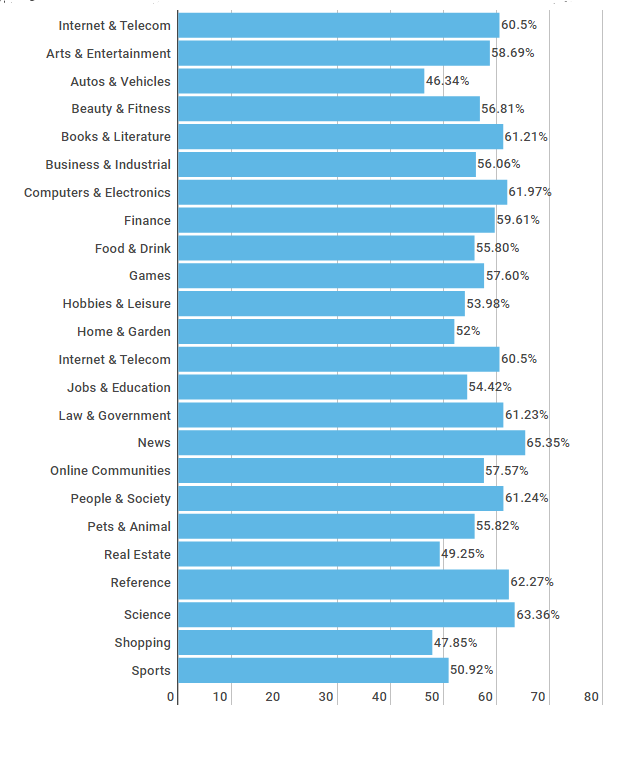
Stats as per Google Benchmarks 2017:
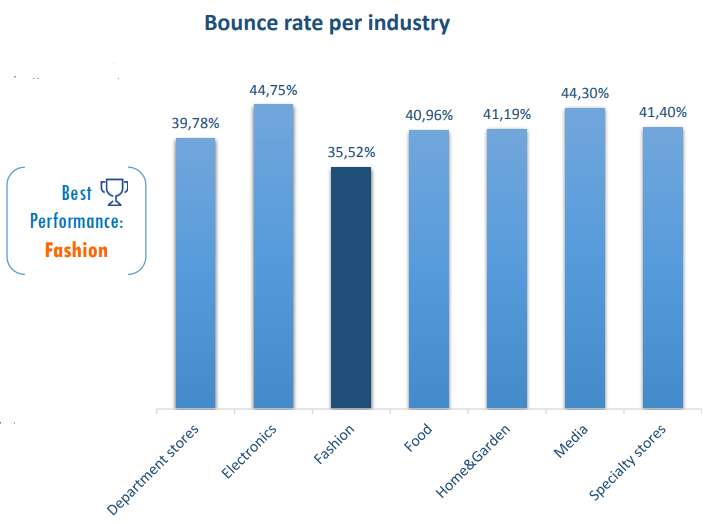
Stats by Ecommerce Europe are:
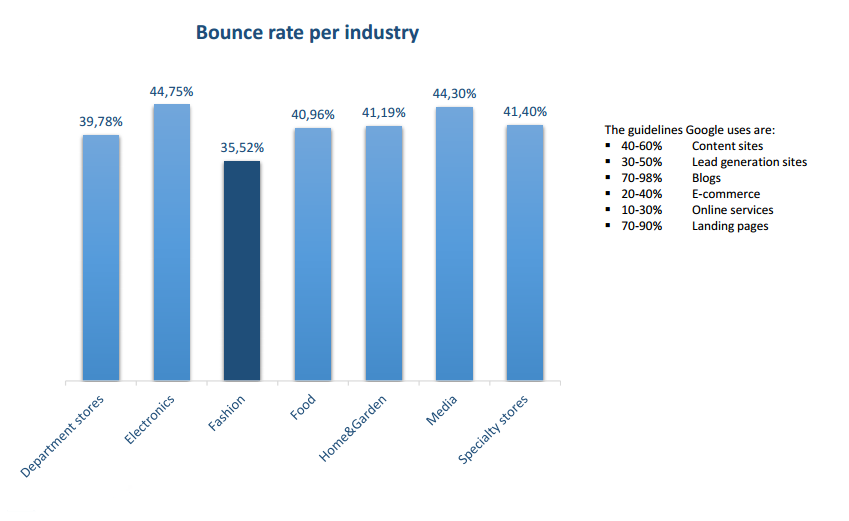
Stats by WolfgangDigital:
Learnings:
- We observe the least bounce rates in Ecommerce/Shopping & Auto Vehicles category.
- Higher Bounce Rates are normal for Blogs, News Websites or Landing Pages.
There might be 100s of reasons for higher bounce rates. Always segment & analyze to find the right cause for your website.
Bounce Rate By Omnichannel vs Pure Players
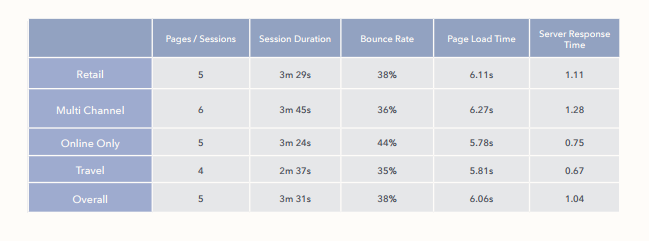
Stats by Ecommerce Europe:
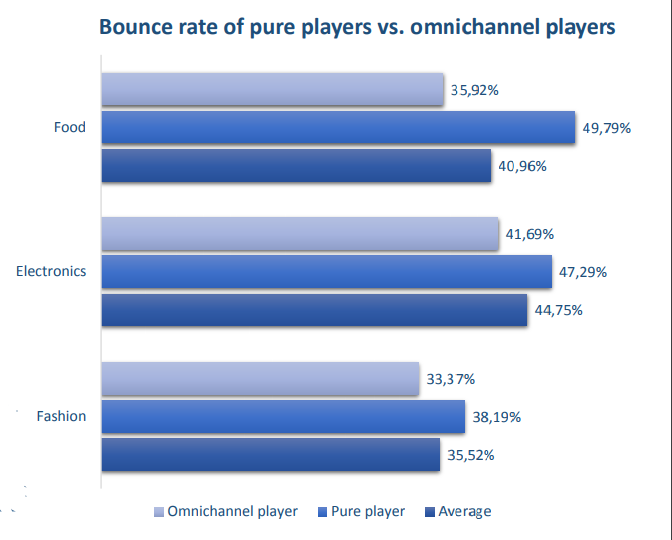
Learnings:
- Pure Players Focus on one particular Category/Product/Brand while Omnichannel Players focus on wider varieties.
- Due to wider varieties in Omnichannel, they tend to have lower bounce rate.
Bounce Rate By Country
Report is based on Google Benchmark Reports 2017:
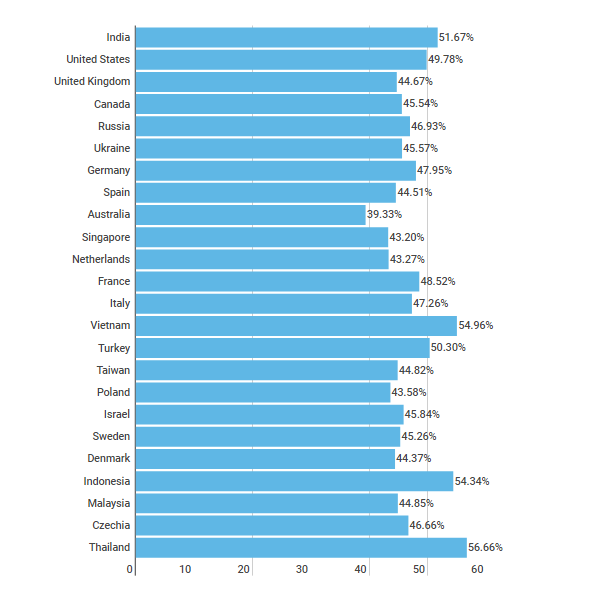
Stats By Ecommerce Europe:
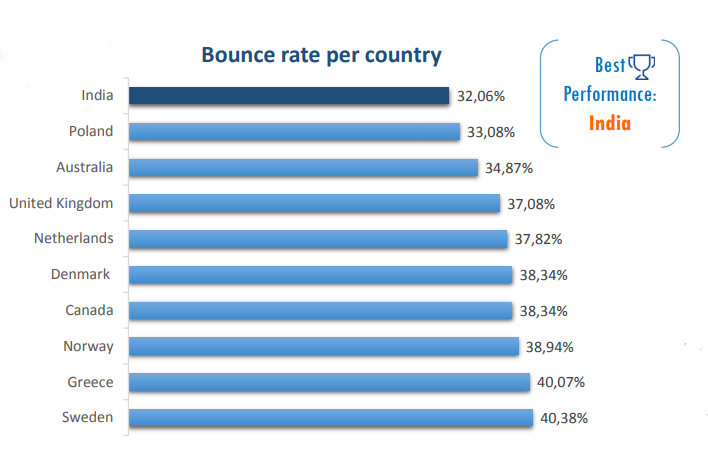
Learnings:
- We see some discrepancy here as Australia seems to have lower bounce rate as per google analytics benchmarks, while Ecommerce Europe lists India as having least bounce rate.
- Personally, I don’t think country specific segment would make any sense to compare bounce rate.
Bounce Rate By Devices
Based On Google Benchmark Reports.
Industry : Shopping/Ecommerce
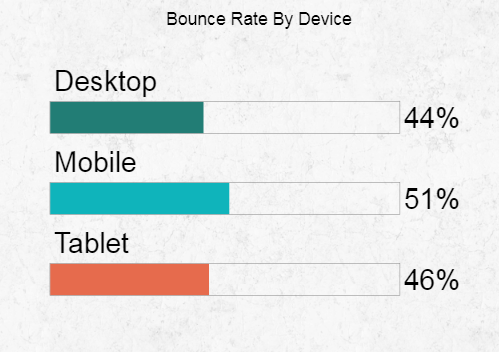
Learnings:
- Most of the times, you might encounter high bounce rates for mobile devices.
- You can use screen recording tools to find any distraction or technical glitches on your mobile site.
You can even implement separate landing pages for mobile sites. Here’s a great guide for that.
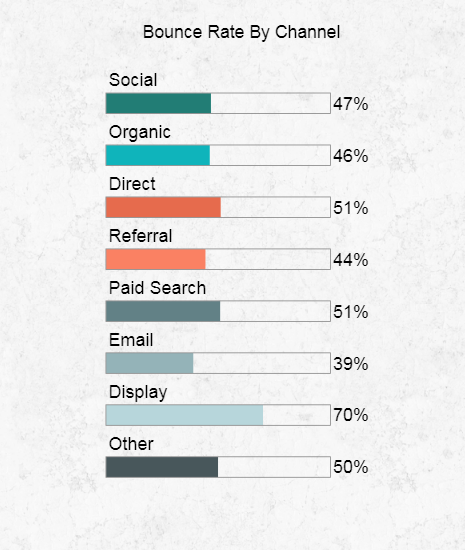
Bounce Rate By Channels
Based On Google Benchmark Reports.
- Industry : Shopping/Ecommerce
Learnings:
- Display has the highest bounce rate while the email channel has the least bounce rate.
- It is quite alarming if you have high bounce rates for Email or Paid Channels.
That is quite obvious…
Display is a form of push marketing where the customer has no intent to buy your product instantly.
While Email visitors maybe your subscribers or previous product purchasers.
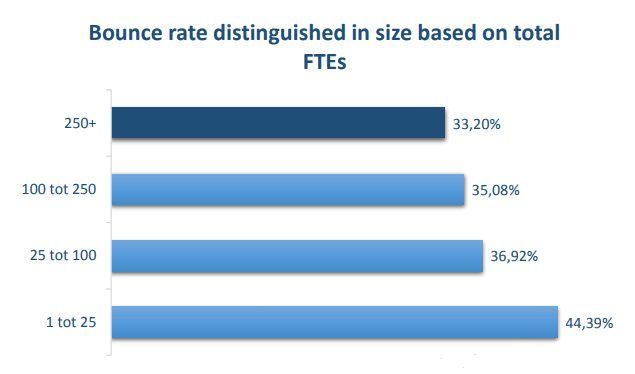
Bounce Rate By Company Size
Stats By Ecommerce Europe 2016:
Learning:
- Small company tends to focus on many things (along with landing page optimization) while bigger companies have a dedicated staff.
- That helps bigger companies to focus more on the landing page quality.
Bounce Rate Benchmarks Sources
Methodology: These reports compare the data with other businesses within your industry who share the data anonymously with google.
Sample Size: The report is based on 10k+ web properties in google analytics having 100-499 Daily Sessions. (All Countries)
Date Range: 2017 Year
This data is based on ecommerce sites participants.
Date Range: 1 July 2016 To 30 June 2017.
Sample Size: 143 Million Sessions.
The Report is focused on Retail Sector & based on 1068 Retailers.
Date Range: 2016 Year
Final Thoughts:
- Bounce rate is a vanity metric & should not be used as a KPI for your business.
- Bounce rate tells nothing about your business performance. Rather focus on important metrics such as LTV, ROI, Conv. Rate, etc
- If you have High Bounce Rates, start by segmenting & analyzing the data to find the cause.
- If you have too much low bounce rates 0-9%, check your analytics code implementation. (multiple code to same property)
- If you run an e-commerce site, you must have low bounce rates. While it is normal to have High Bounce Rates for Display Campaigns, Landing Pages & Blogs.
Lastly, Make sure you have proper code implementation & configuration in google analytics.
